Last year at work, I was part of the college bowl pick’em. Nothing new, I used to do the CFB bowl pick’ems with my college roommates and others. But last year, I decided to scrape the data and use different Machine Learning (ML) algorithms to predict winners.
Note: I treated this as a classification problem, 1 - Win, 0 - Lose. For those curious about the ML algorithms and the parameters selected, there is a follow-up post.
Bowl Predictions
Prediction accuracies will be updated as bowl season progresses. I’m going to include 4 different set of predictions: 1. Personal picks, 2. Algorithm 1 - Random forest, 3. Algorithm 2 - XGBoost, 4. Algorithm 3 - Support Vector Machines (SVM)
Let’s look at what each algorithm thinks is important. These were all the possible stats available for all 128 teams in NCAA-FBS (Division I).
##  [1] "3rd Down Conversion Pct"         "3rd Down Conversion Pct Defense"
##  [3] "4th Down Conversion Pct"         "4th Down Conversion Pct Defense"
##  [5] "Fewest Penalties Per Game"       "Fewest Penalty Yards Per Game"
##  [7] "First Downs Defense"             "First Downs Offense"
##  [9] "Kickoff Returns"                 "Net Punting"
## [11] "Passing Offense"                 "Passing Yards Allowed"
## [13] "Punt Returns"                    "Red Zone Defense"
## [15] "Red Zone Offense"                "Rushing Defense"
## [17] "Rushing Offense"                 "Scoring Defense"
## [19] "Scoring Offense"                 "Team Passing Efficiency"
## [21] "Team Passing Efficiency Defense" "T.O.P"
## [23] "Total Defense"                   "Total Offense"
## [25] "Turnover Margin"
Algorithm 1 - Random Forest vs. Algorithm 2 - XGboost
Random Forests (RF) are an ensemble learning method using decision trees. The model has the capability to select and identify the important variables. XGboost is an extreme gradient boosting method applied to decision trees. Similarly to RF it also has the capability to identify important variables.
Let’s see what we’ve got here.
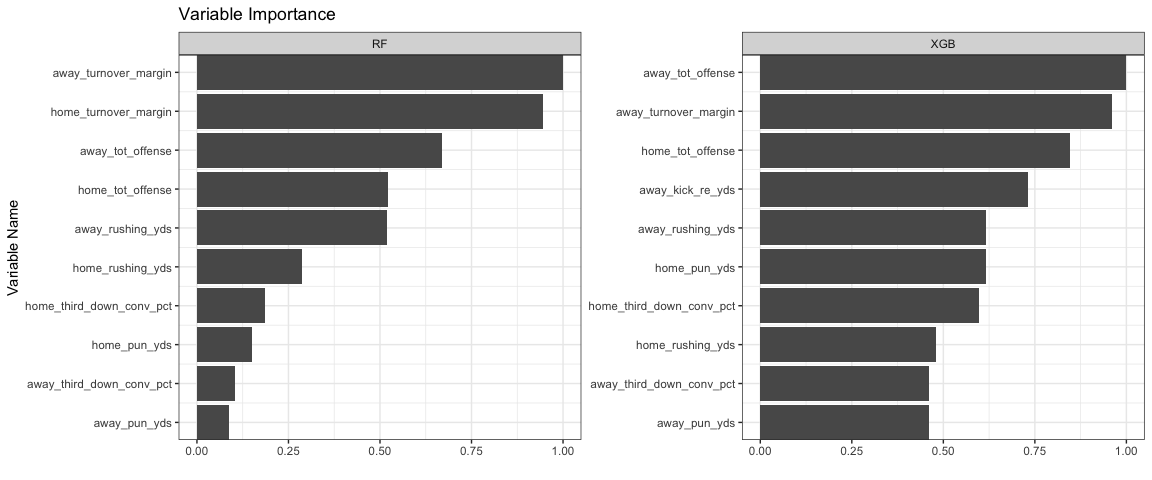
Before we dive into this, the models were run to classify/predict whether the home team wins. Above we see the top 10 stats that each model thinks is important to predict home team wins. They both tend to cover the same spectrum, interestingly enough XGB doesn’t consider the home_turnover_margin in the top 10 variables.
I’d say overall, it tends to do a good job since it captures (1) turnovers, (2) offensive capability, (3) special teams (field position), and (4) clutch conversions (third down %). You can also argue/point out that it captures defense since turnovers and the number of total yards the other team gains.
For Support Vector Machines (Algorithm 3 - SVM), they are a bit more complex, and hence don’t provide straight forward variable importances. If you want some more detail on this, look for the follow up post.
Anyways let’s take a look at the predictions.
Predictions
| Away Team | Home Team | Algorithm 1 | A1 - Confidence | Algorithm 2 | A2 - Confidence | Algorithm 3 | A3 - Confidence | Actual |
|---|---|---|---|---|---|---|---|---|
| Troy | North Texas | North Texas | 0.74 | North Texas | 0.99 | North Texas | 0.77 | Troy |
| Georgia St. | Western Ky. | Western Ky. | 0.02 | Georgia St. | 0.11 | Western Ky. | 0.44 | Georgia St. |
| Boise St. | Oregon | Oregon | 0.81 | Oregon | 0.99 | Oregon | 0.66 | Boise St. |
| Marshall | Colorado St. | Colorado St. | 0.83 | Marshall | 0.88 | Colorado St. | 0.79 | Marshall |
| Fla. Atlantic | Akron | Fla. Atlantic | 0.77 | Fla. Atlantic | 0.97 | Fla. Atlantic | 0.71 | Fla. Atlantic |
| SMU | Louisiana Tech | SMU | 0.19 | SMU | 0.79 | Louisiana Tech | 0.05 | Louisiana Tech |
| Temple | FIU | FIU | 0.68 | Temple | 0.50 | FIU | 0.37 | Temple |
| UAB | Ohio | Ohio | 0.60 | Ohio | 0.99 | Ohio | 0.64 | Ohio |
| Wyoming | Central Mich. | Central Mich. | 0.36 | Central Mich. | 1.00 | Central Mich. | 0.75 | Wyoming |
| South Fla. | Texas Tech | South Fla. | 0.30 | South Fla. | 0.68 | South Fla. | 0.34 | South Fla. |
| Army West Point | San Diego St. | Army West Point | 0.19 | Army West Point | 0.37 | Army West Point | 0.38 | Army West Point |
| Appalachian St. | Toledo | Toledo | 0.54 | Appalachian St. | 0.84 | Toledo | 0.43 | Appalachian St. |
| Fresno St. | Houston | Houston | 0.80 | Houston | 1.00 | Houston | 0.73 | Fresno St. |
| West Virginia | Utah | Utah | 0.39 | West Virginia | 0.98 | West Virginia | 0.07 | Utah |
| Duke | Northern Ill. | Northern Ill. | 0.65 | Northern Ill. | 0.96 | Northern Ill. | 0.45 | Duke |
| UCLA | Kansas St. | UCLA | 0.80 | UCLA | 0.99 | UCLA | 0.35 | Kansas St. |
| Florida St. | Southern Miss. | Southern Miss. | 0.50 | Southern Miss. | 0.96 | Southern Miss. | 0.49 | Florida St. |
| Boston College | Iowa | Boston College | 0.37 | Boston College | 0.41 | Boston College | 0.09 | Iowa |
| Arizona | Purdue | Arizona | 0.27 | Arizona | 0.44 | Arizona | 0.79 | Purdue |
| Texas | Missouri | Missouri | 0.75 | Missouri | 1.00 | Missouri | 0.84 | Texas |
| Virginia | Navy | Navy | 0.90 | Navy | 1.00 | Navy | 0.92 | Navy |
| Oklahoma St. | Virginia Tech | Oklahoma St. | 0.33 | Oklahoma St. | 0.82 | Oklahoma St. | 0.43 | Oklahoma St. |
| Stanford | TCU | TCU | 0.50 | TCU | 0.99 | TCU | 0.54 | TCU |
| Michigan St. | Washington St. | Washington St. | 0.48 | Washington St. | 1.00 | Washington St. | 0.51 | Michigan St. |
| Wake Forest | Texas A&M | Texas A&M | 0.16 | Wake Forest | 0.55 | Texas A&M | 0.19 | Wake Forest |
| Kentucky | Northwestern | Northwestern | 0.69 | Northwestern | 0.99 | Northwestern | 0.34 | Northwestern |
| New Mexico St. | Utah St. | Utah St. | 0.52 | New Mexico St. | 0.94 | Utah St. | 0.23 | New Mexico St. |
| Ohio St. | Southern California | Southern California | 0.29 | Ohio St. | 0.50 | Ohio St. | 0.17 | Ohio St. |
| Louisville | Mississippi St. | Mississippi St. | 0.26 | Mississippi St. | 0.97 | Louisville | 0.19 | Mississippi St. |
| Iowa St. | Memphis | Memphis | 0.39 | Memphis | 1.00 | Memphis | 0.79 | Iowa St. |
| Washington | Penn St. | Penn St. | 0.01 | Penn St. | 1.00 | Penn St. | 0.37 | Penn St. |
| Miami (FL) | Wisconsin | Wisconsin | 0.82 | Wisconsin | 1.00 | Wisconsin | 0.78 | Wisconsin |
| Michigan | South Carolina | Michigan | 0.42 | Michigan | 0.64 | Michigan | 0.04 | South Carolina |
| Auburn | UCF | UCF | 0.01 | UCF | 0.98 | UCF | 0.14 | UCF |
| Notre Dame | LSU | Notre Dame | 0.16 | Notre Dame | 0.68 | Notre Dame | 0.34 | Notre Dame |
| Oklahoma | Georgia | Georgia | 0.30 | Oklahoma | 0.89 | Oklahoma | 0.13 | Georgia |
| Clemson | Alabama | Alabama | 0.00 | Alabama | 0.99 | Alabama | 0.18 | Alabama |
Note, the confidence of each prediction is also provided using the probability the model provided in predicting a home win or away win. I’ll update this
I’m quite unhappy with a few picks: (1) UCLA over Kansas St, I’m a huge Bill Synder fan. (2) TCU over Stanford, picking against the ground game of Stanford? (3) Also the confidence in Bama beating Clemson, scares me. 99% for XGB? JEEZ
I wish I had some conference and scheduled based statistics as well. I’d love to incorporate SOS, power-5 opponents, etc. There are probably a million different things that can be useful. As I continue this yearly, I’ll look for more statistics to include. Let me know if you think there are any that I should consider!
Final Results
Algorithm 1 - 16/37 = 43.2%
Algorithm 2 - 21/37 = 56.7%
Algorithm 3 - 15/37 = 40.5%
None of these are truly fantastic. I would like to break the 60% threshold. Just like last year, there’s a lot left to learn going forward. I’ll take a stab at this again for the 2018 bowl season. So long folks!
Congrats to Alabama! TUAAAAAAAA!